Frequently asked questions
Where can I get help with my Datawrapper chart?
Be sure you’ve read or searched through the documentation on this site and the Datawrapper Academy to see if your question has already been answered.
If you’re still stuck, ask for help in the Datawrapper Helpline channel in Teams.
Anyone from the newsroom can help you with chart issues in this channel. The graphics team will make our best attempt to help here, too, but unfortunately, we can’t staff this channel across working hours so responses may be delayed.
If you’re on deadline or have an immediate need then write to all.graphics@tr.com, which will get a quicker response.
I published my chart in Datawrapper. Now what?
Find you chart’s link card posted in the Datawrapper Charts Teams channel, then read “Adding your chart to a story”.
I clicked publish in Datawrapper, but don't see anything happen in the Datawrapper Charts Teams channel. What do I do?
If you don’t see any cards created for your chart in the Datawrapper Charts Teams channel, then you may have created your chart in a private folder, not the shared Reuters one.
Take a look at your chart in Datawrapper and confirm it says the chart was in a “Reuters” folder in the upper left corner of the screen as below:
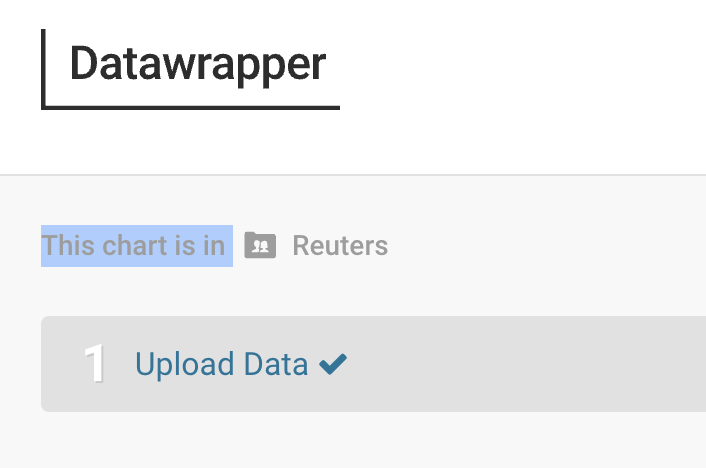
If it is, contact the Reuters Graphics team in the Datawrapper Helpline channel.
If not, go to the Datawrapper “Archive” (upper right), find your chart in your private folder, click “Copy to” and make a copy of your chart in the shared “Reuters” folder.
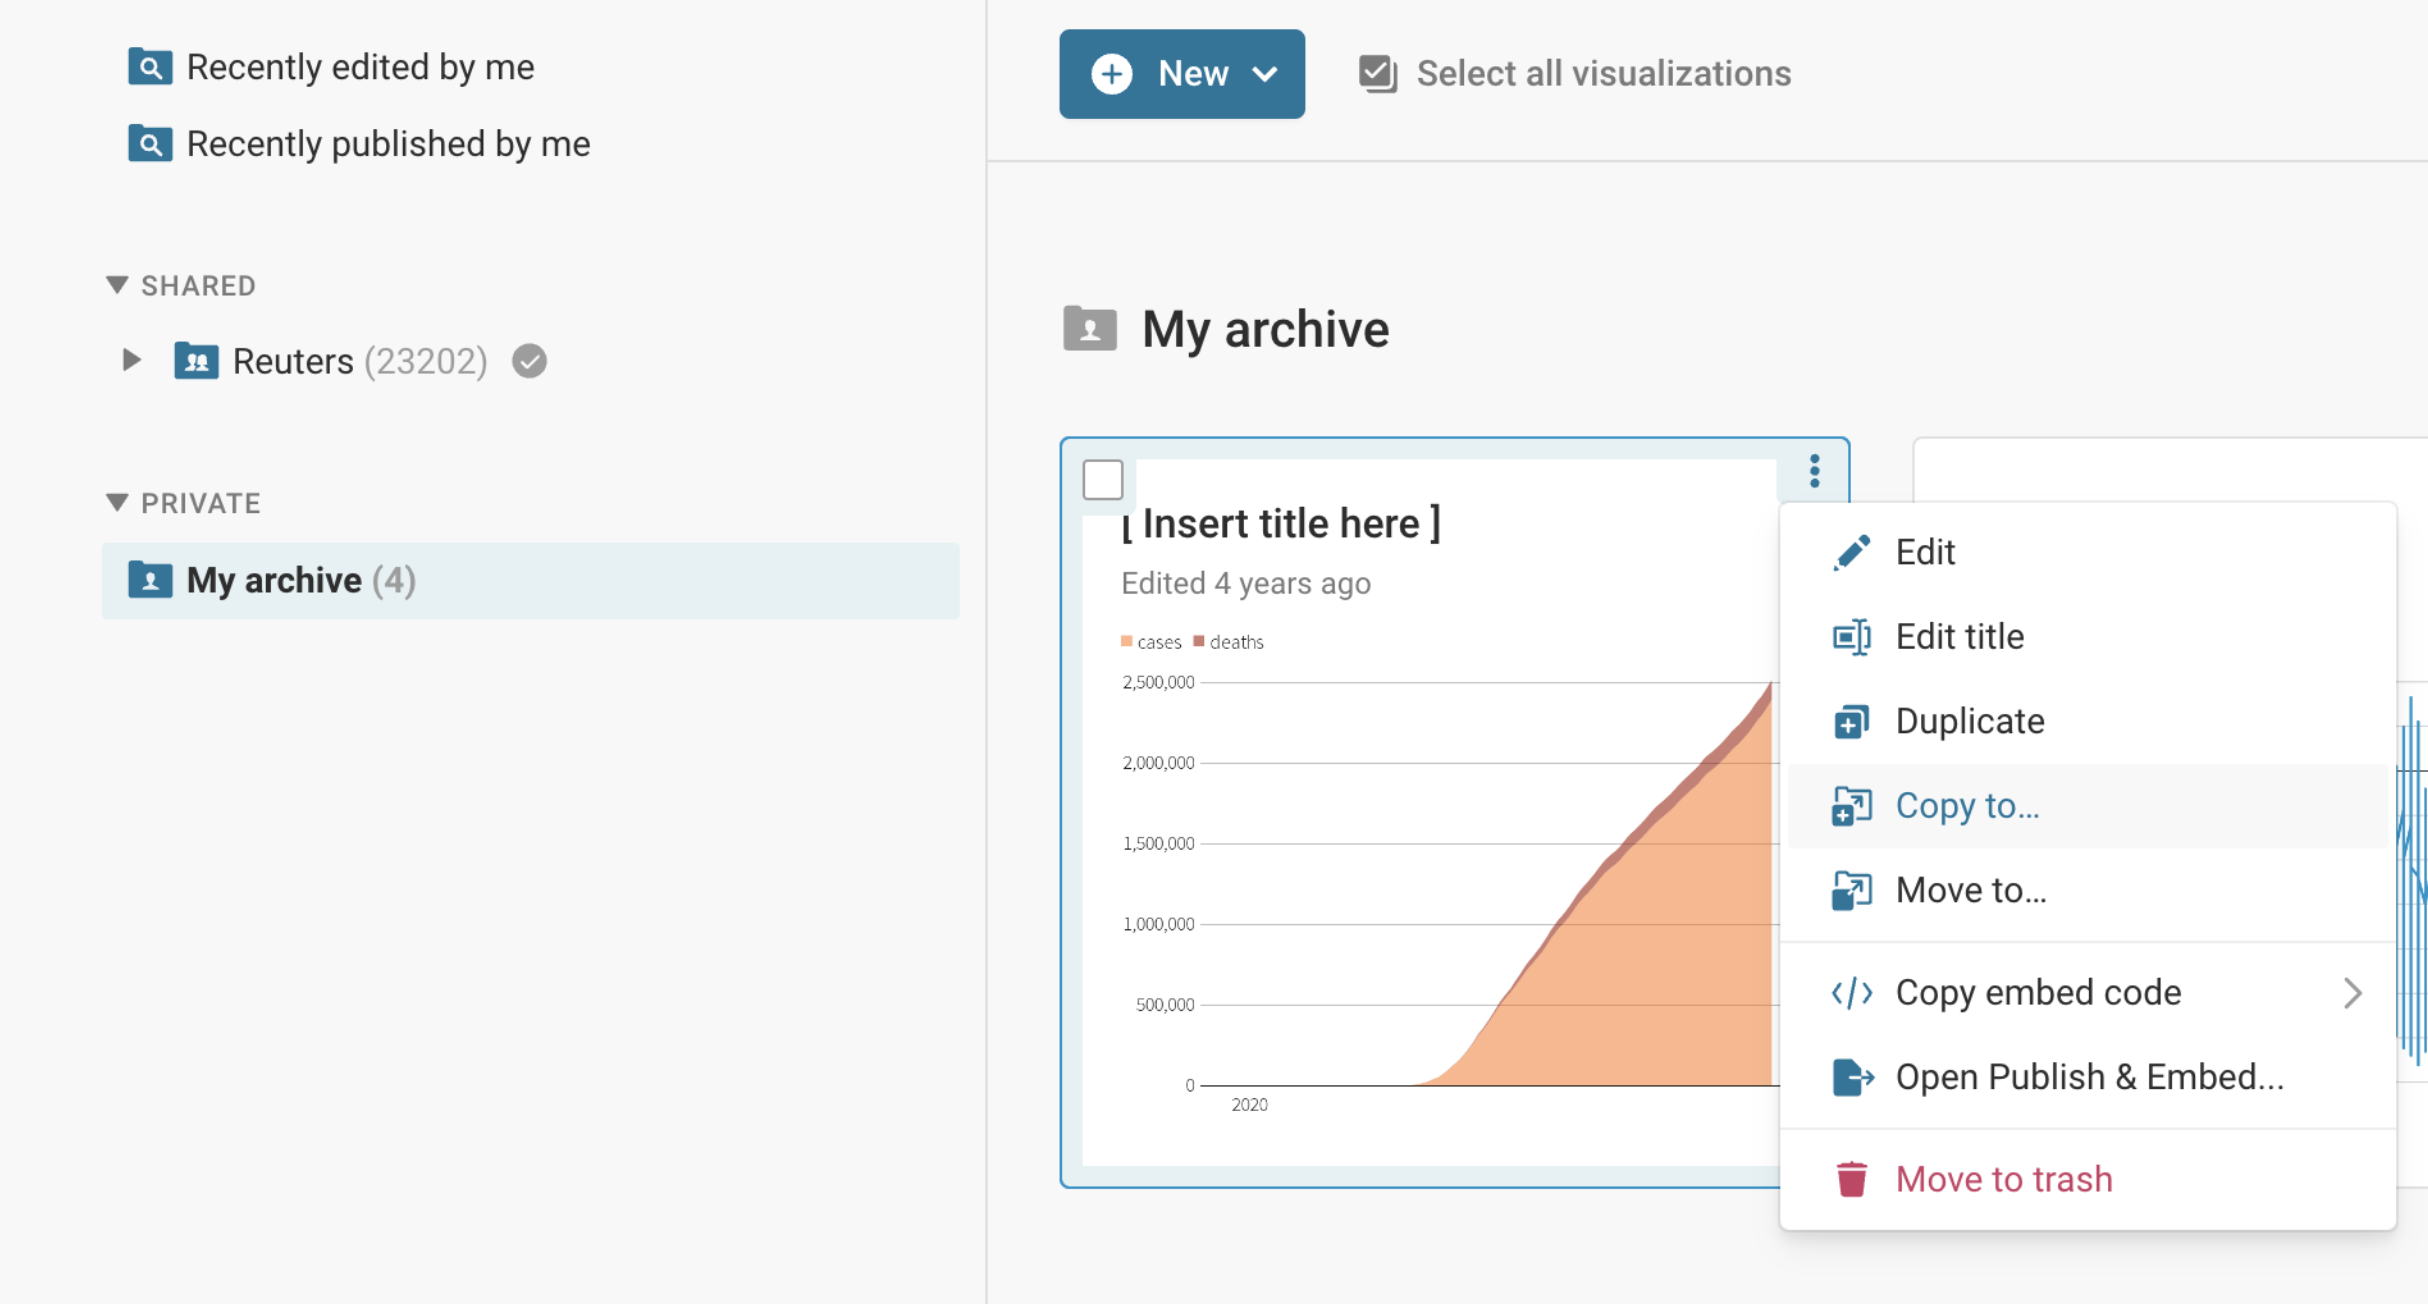
With the new chart opened for editing, remove “(Copy)” from the title and publish that chart, which should now correctly route through the Reuters publishing channels.
How do I include my chart in my story?
See “Adding your chart to a story” for a demonstration of how to then embed your chart in Lynx Editor Online or ask the desk for help getting your chart in your story.
How do I get my chart in Reuters Connect?
Only charts approved by the graphics team are sent on to clients in Reuters Connect. If you want to publish your chart separately to clients on Connect, ask a Reuters Graphics staff member to review your chart in the Datawrapper Helpline channel in Teams. (Be sure to send a link to the editable chart in Datawrapper when you do.)
If your chart passes our editorial check, we’ll be happy to move it along for you.
My chart has an error when publishing. What do I do?
Common errors will be explained in the card created for your chart in the Datawrapper Charts Teams channel.
(The most common error we see is malformed or missing metadata like slugs. Be sure to read how to format your metadata here.)
If your chart still has a publishing error, contact the Reuters Graphics team in the Datawrapper Helpline channel in Teams for assistance.
Who edits Datawrapper charts?
The graphics team does not edit or review all charts created in Datawrapper. (We do regularly make some newsroom-created charts available to clients in Connect, which we do review.)
In general, though, your regular editor is your editor for Datawrapper charts. Make sure you show your charts to them before including it in your stories.
Charts should also be copyedited, just like any other piece of reporting.
When should I pitch a chart to Reuters Graphics and when should I use Datawrapper?
If you have a chart idea and it fits one the chart types Datawrapper provides for, then the fastest route to the chart you want is through Datawrapper.
Even though we can only pick up a few of the chart requests we receive on our team, we always encourage you to submit your ideas to all.graphics@tr.com. In many cases, we’ll expand on an idea in conversation and find opportunities to build even more engaging dataviz in your data. (When approaching us, it’s always best to send us some data as early as possible.)
If we’re already booked up, though, we’ll be clear with you and hope to catch you on the next one.
What's the Reuters Graphics team's role in supporting Datawrapper?
The graphics team supports the software that publishes Datawrapper charts to our Reuters servers. We also maintain the Datawrapper Charts and Datawrapper Helpline channels in Teams and the training materials you’re reading now. We also host occassional office hours sessions to talk about charting with the newsroom.
We do not always have the capacity to assist in making individual charts, but we’ll always try to help where we can and are keen to coach.
How do I make Datawrapper recognise dates in my data?
Checkout the date formats Datawrapper recommends here and make sure the dates in your data are formatted according to one of those approved styles.