Making your first chart
Once you have your Datawrapper account, you’re ready to create your first chart.
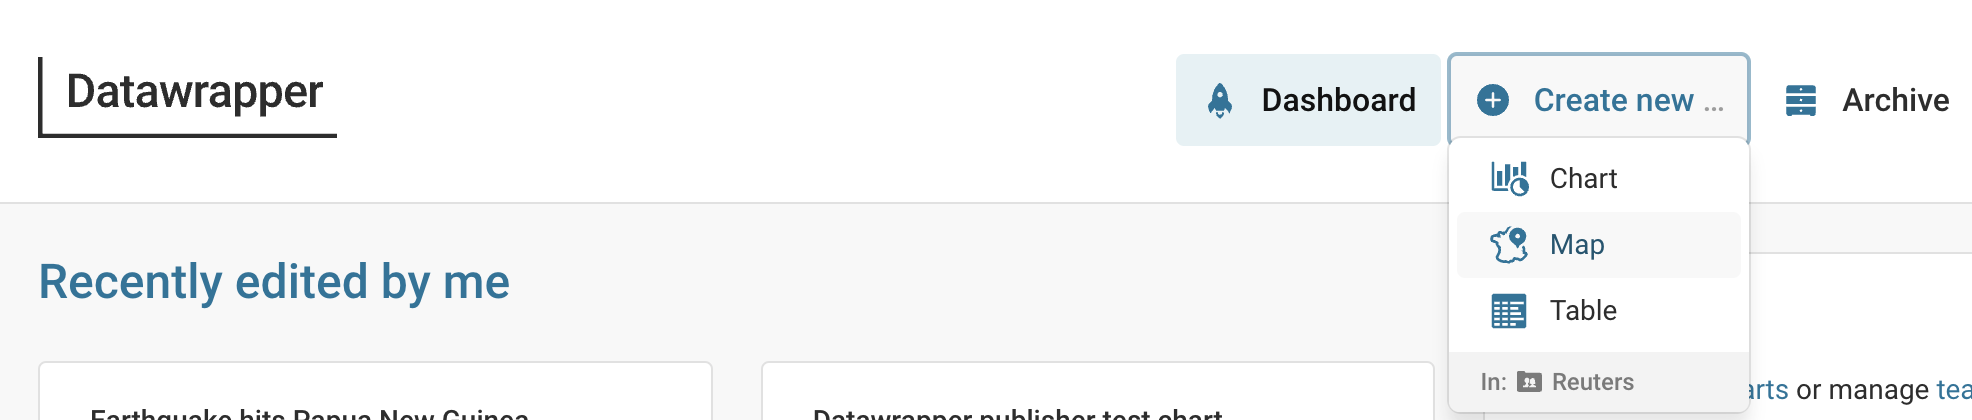
Start a chart
Login to Datawrapper at: https://app.datawrapper.de/
Then select a new chart, map or data table to create from the menu:
Preparing and uploading your data to Datawrapper
All charts start with clean data, and most of that data should come from a spreadsheet. But just because your data is in a spreadsheet doesn’t mean it’s ready to chart with.
Almost all data should be “square” with a single header row describing your data and individual datapoints listed down the columns. For example:

If your data is not square, you may need to reformat it by hand or use a pivot table in Excel. You can also try tools like Stanford’s DataWrangler for more complex data transformations.
Once your data is ready, you’ll simple copy and paste it from your spreadsheet into the text box on the “Upload Data” tab of a new chart:

You can also upload your entire spreadsheet directly, connect to a Google sheet or link up with a live JSON or CSV API.

With your data prepped and uploaded, click “Proceed” to take you to the “Check and Describe” tab.
In this step, you can make sure Datawrapper is correctly interpretting your data. Common problems include things like years being treated as numbers instead of dates or numbers parsed incorrectly as text. You can also divide or round columns of numbers in this step to make your chart more readable.
To change the format, click a column header (“A”, “B”, “C”, etc. below) and choose the right options for your data in the panel left of the table.

Once your data is correctly formatted, uploaded and parsed, you’re ready to start charting.
Choosing the right chart type
With your data squared away, Datawrapper will make an educated guess at what chart type is best for your data, but you can choose to override that choice, too.
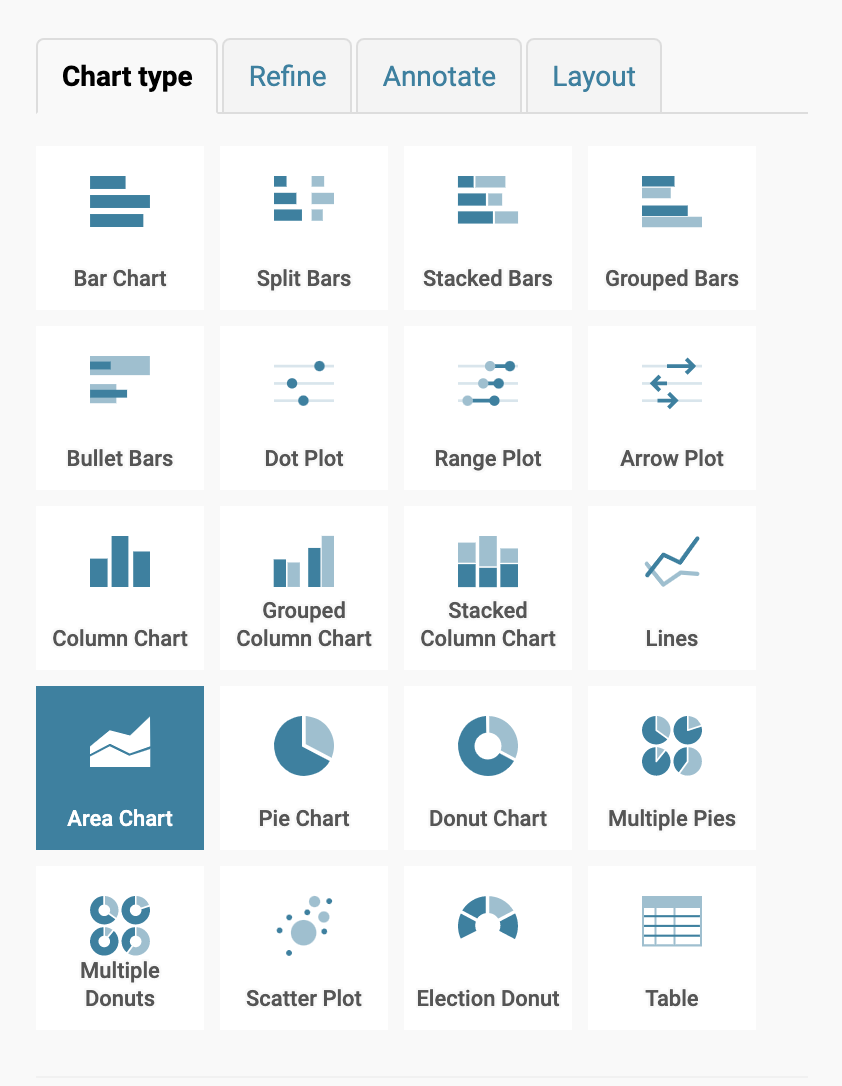
Choosing the right chart type is an important step to make sure you’re communicating your data clearly and correctly.
Our friends in the graphics department at the FT have provided a very useful guide to what kinds of chart best match to different kinds of data. We highly recommend it and you can download it here.
Refining your chart
On the “Refine” and “Annotate” tabs, you can further design your chart to meet your needs. This includes adding text annotations, sorting the data points, picking a number format to display your values on your axes and more. It also enables you to pick colours for your chart elements from our official Reuters colour palette, but please do not use other colours than what are available in the default colour picker. That’s our style!

Refining your chart is an easy place to make a mistake that can distort your data or forget to label important elements necessary to communicate your data clearly. Check out the Dos and Don’ts for tips on how to avoid common missteps here.
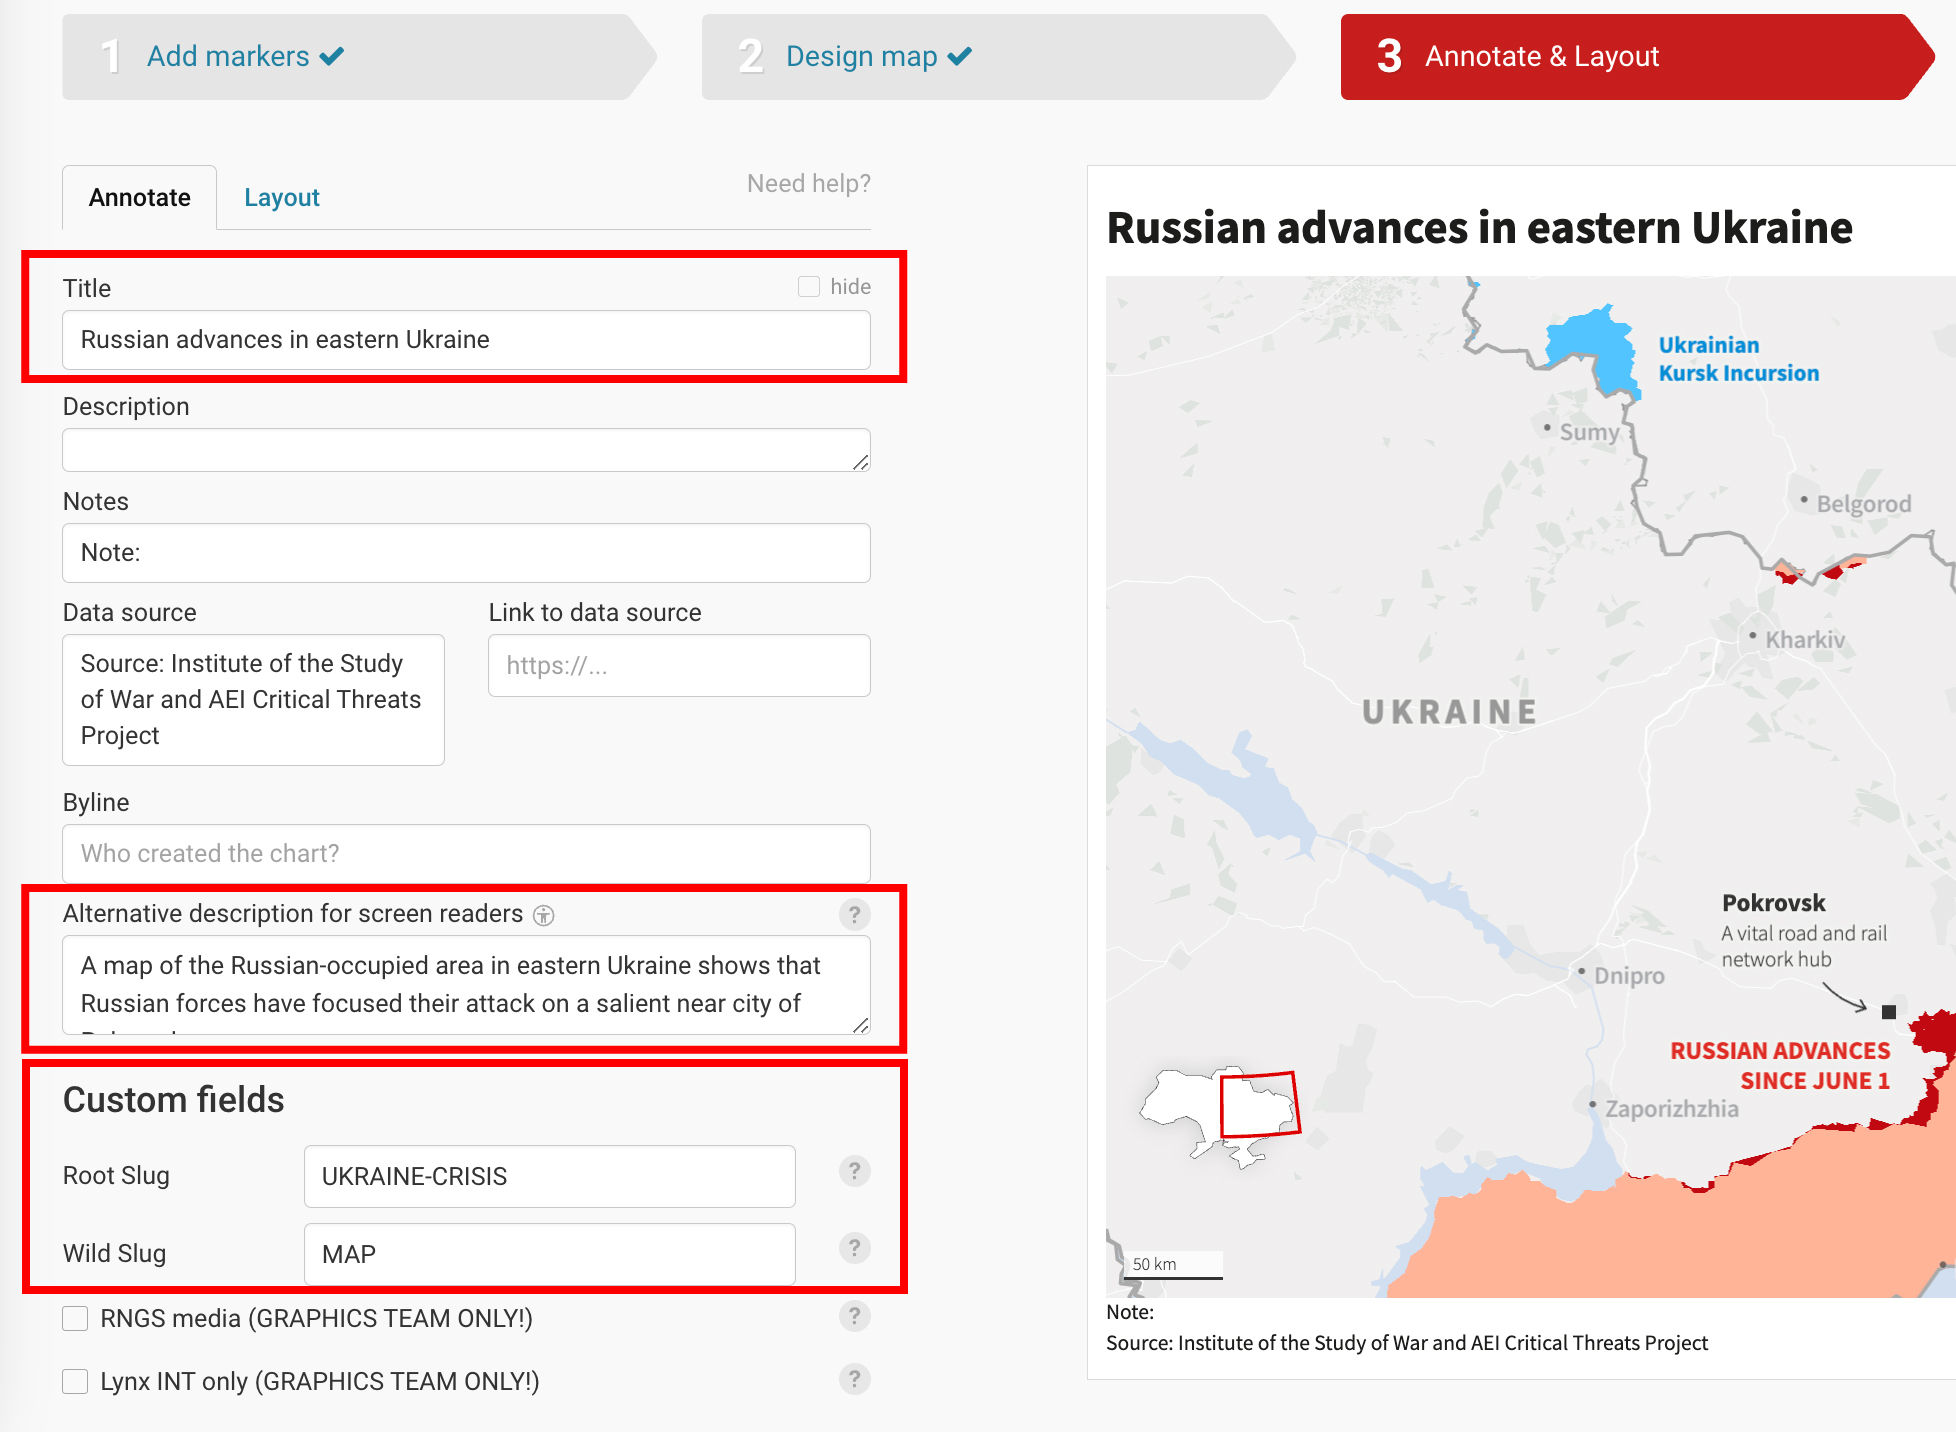
Filling out the metadata for you chart
In order to publish your chart, you must fill out a few fields on the “Annotate” tab.
-
Your chart must have a title and in most cases also a description and a data source (include a link to the raw data whenever possible, too).
-
You must write an alternative description for screen readers which describes what your chart shows for visually impaired readers or others using assistive technology to read your chart.
-
You must also add a root slug. A wild slug is optional.
Without this basic information your chart will not successfully publish.